1. Brief
This brief requires us to record the data around us or individuals and make a visual design. Create two outcomes to convey a narrative about the individual or discovery data. The results must be designed in a creative and illuminating way developed from a large number of preliminary studies.
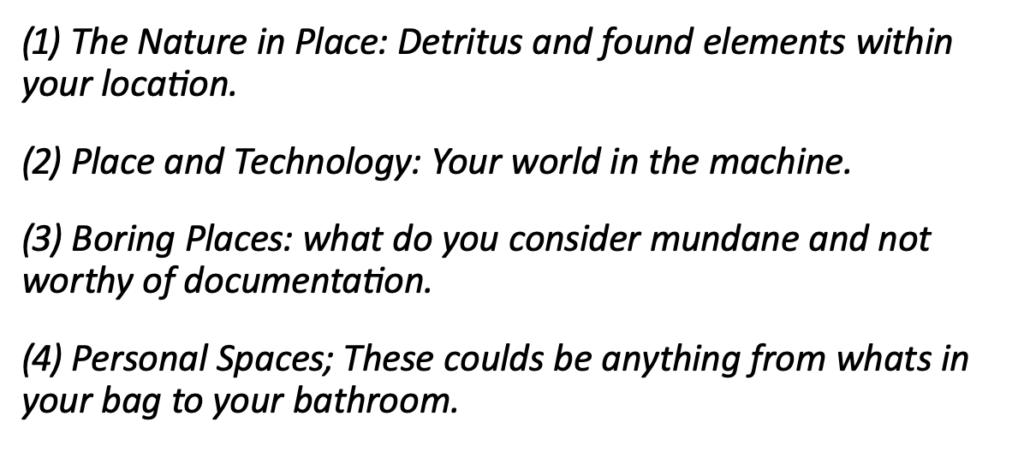
We were asked to choose one of these four topics. After thinking, I decided to choose (4)Personal Spaces to record data about myself
According to Personal Spaces, I made a mind map, which is divided into four parts: sleep, food, play and study

2. IDEA
Idea 1
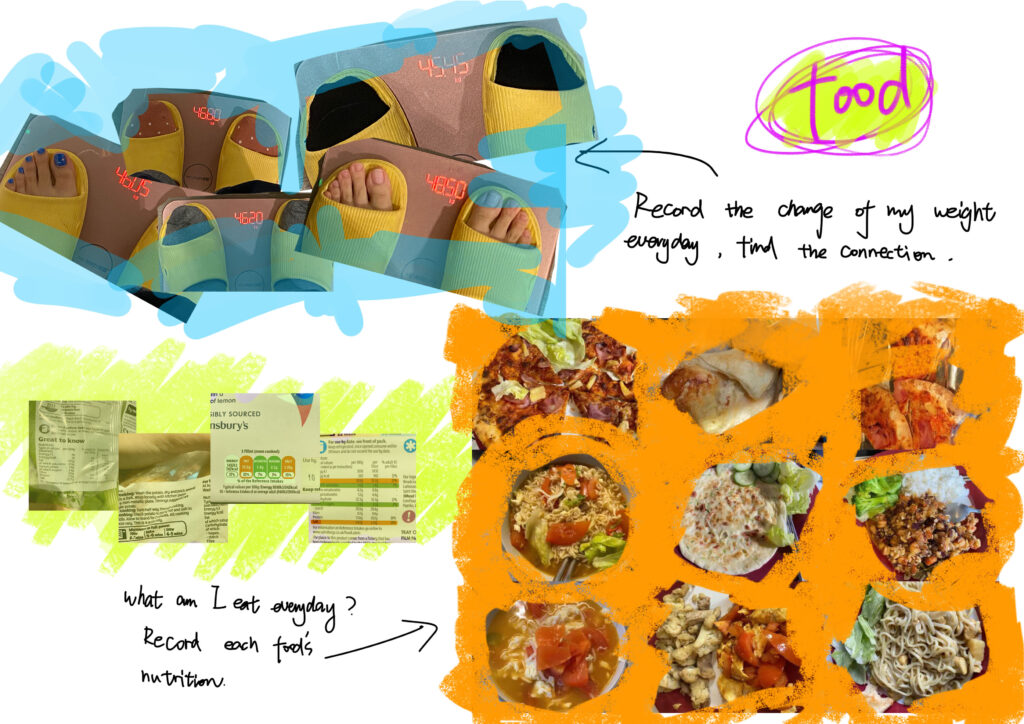
Diet&Weight
Because I’m not good at cooking and I don’t know much about the diet structure, I lost weight after coming to the UK. In order to change this phenomenon, I plan to keep a record of the food I eat every day, as well as the energy and nutritional content of each food. The relationship between food and body weight was recorded.
Idea 2
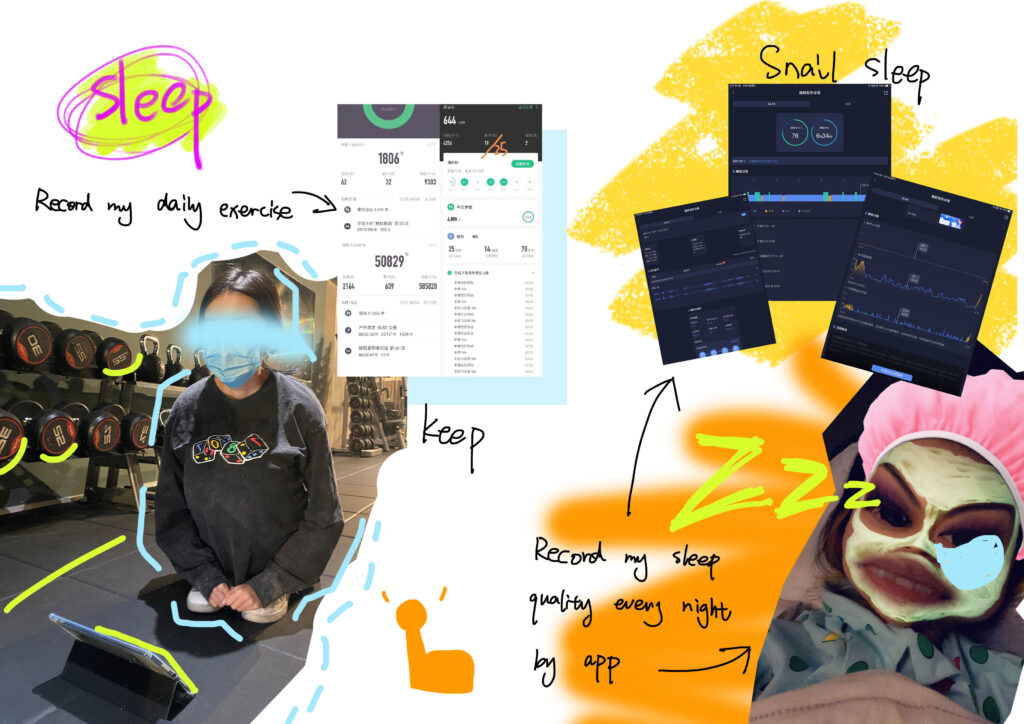
Exercise&Sleep
I go to the gym occasionally, but sometimes I do a lot of exercise and sometimes I just go for a run because I don’t have a planned workout. I’ve found that sometimes it makes me sleep better and sometimes it makes me sleep worse. In order to know whether the exercise before bedtime can affect my sleep quality, I decided to collect the data of my daily exercise amount and sleep quality for data visualization design.
Since sleep quality data is too abstract to collect, I chose IDEA1, food, as my subject. It mainly collects the nutritional content of the food I eat every day.
3. Data record
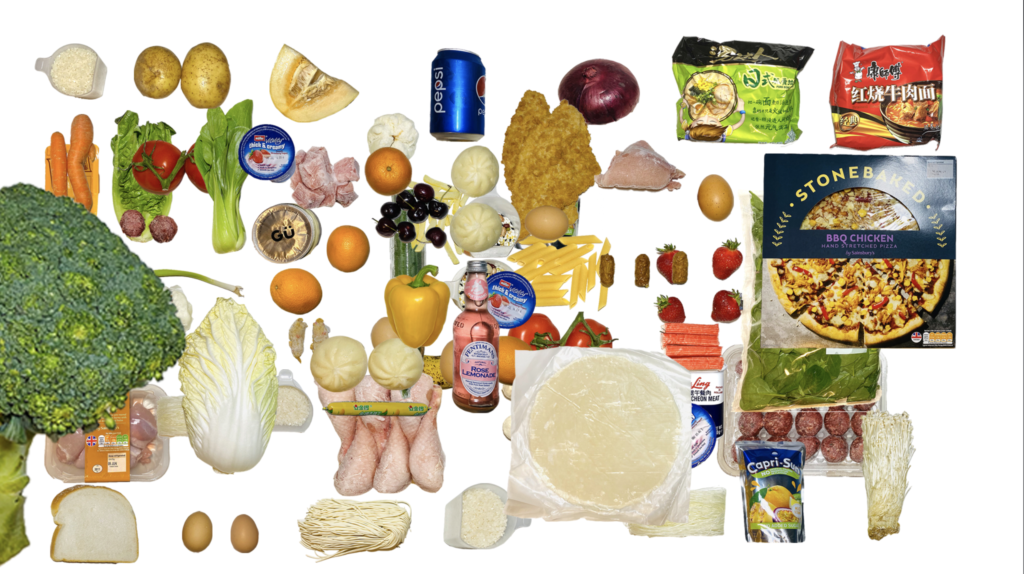
I recorded the amount of nutrition in my diet every day from June 10 to June 19. I wrote down the weight of each food and used an app that professionally recorded the amount of nutrition to record my diet. I also took photos of the food every day.
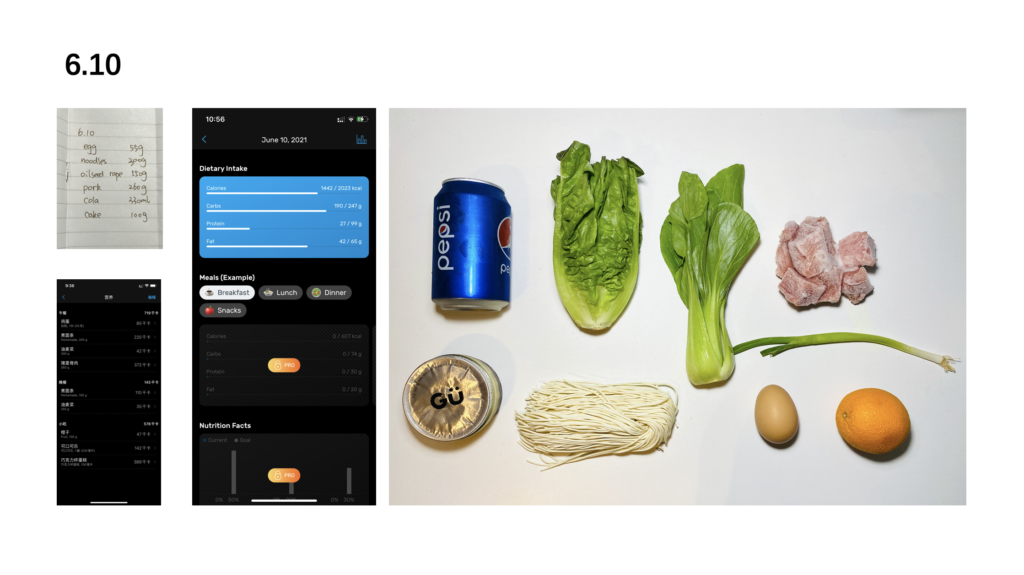
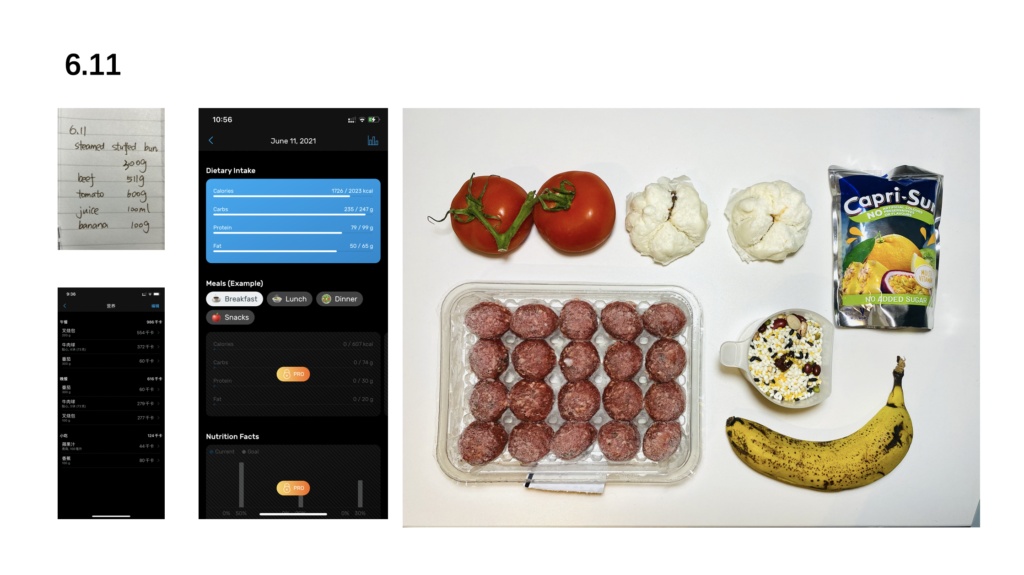
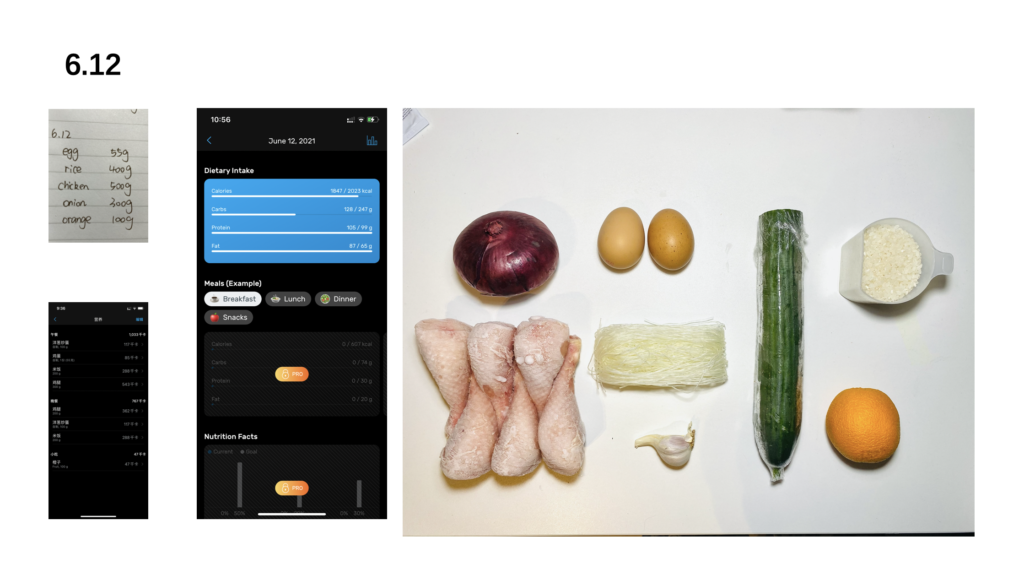
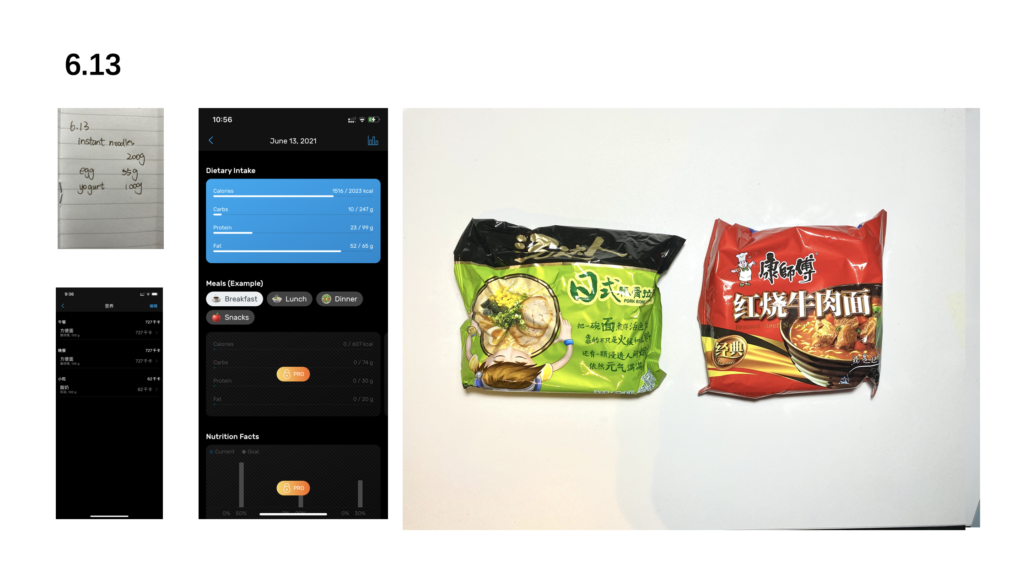
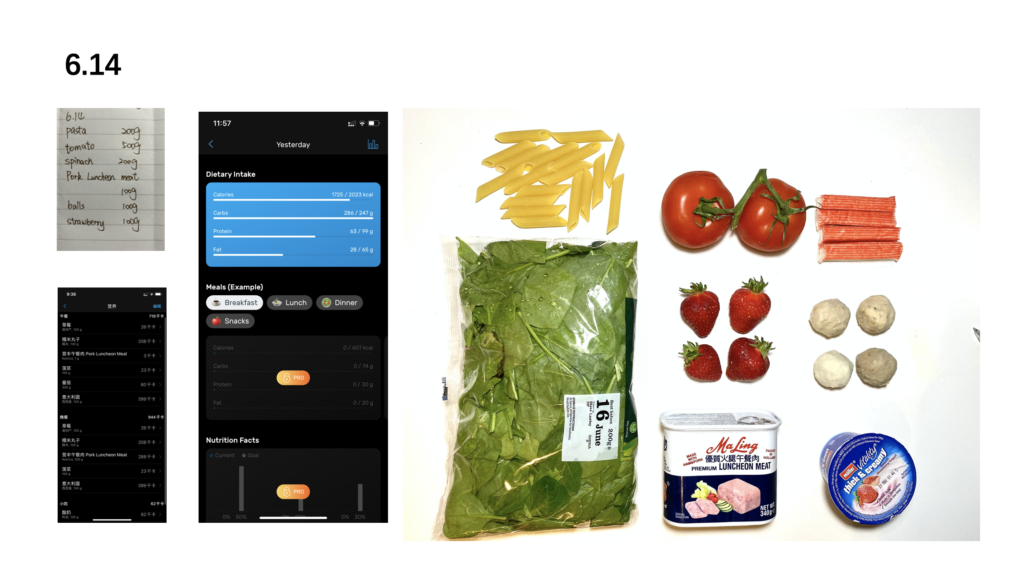

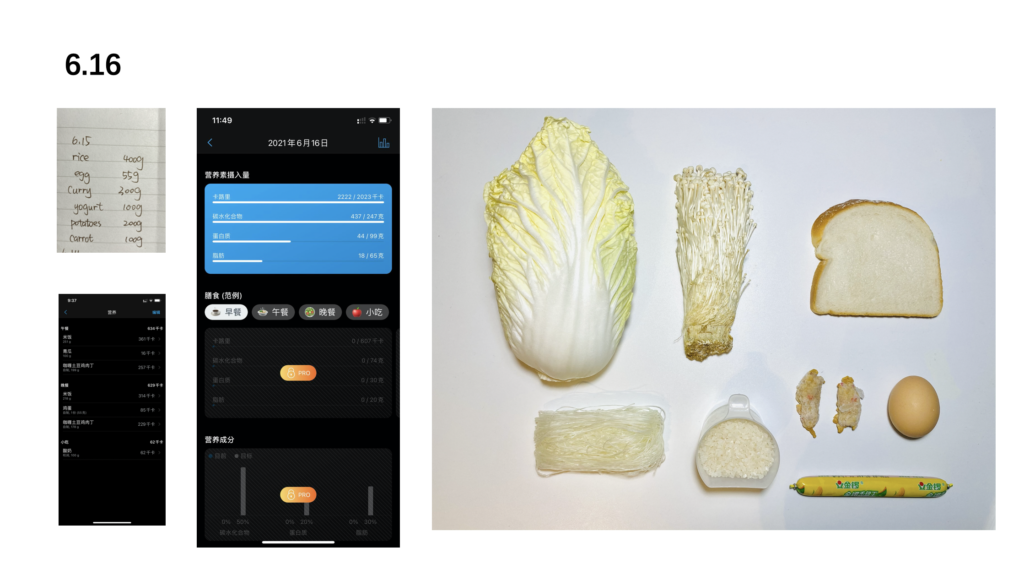
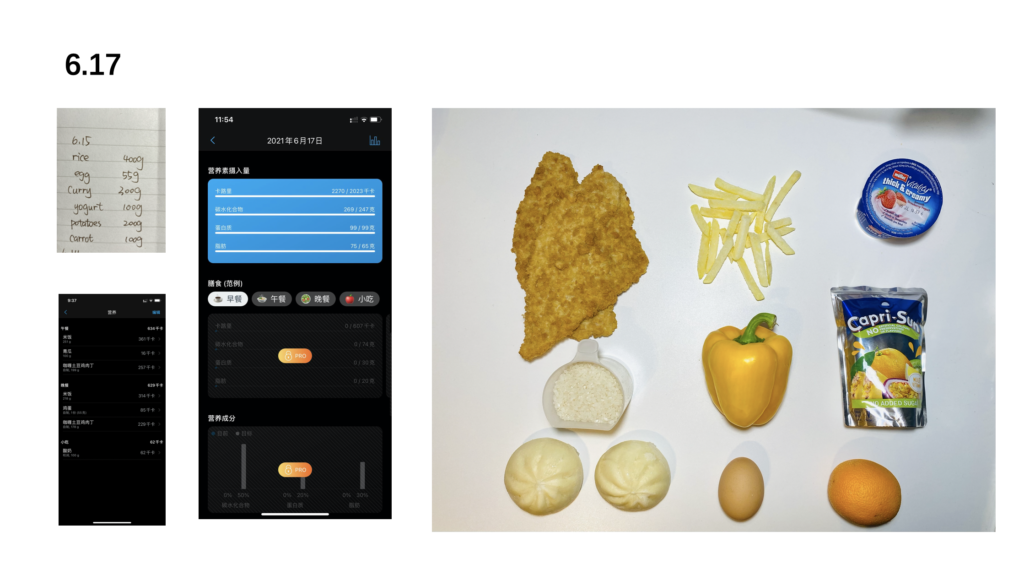
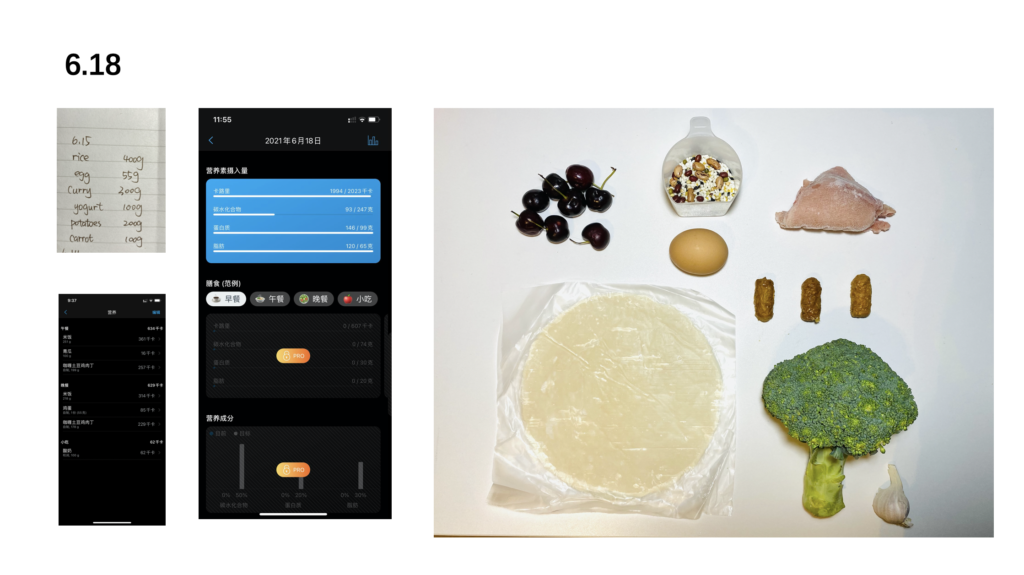
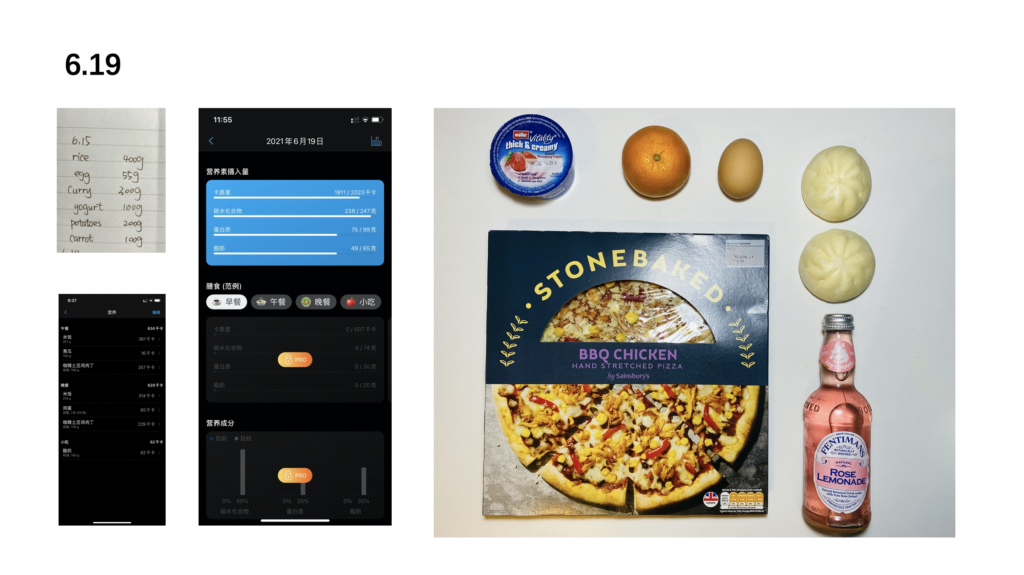
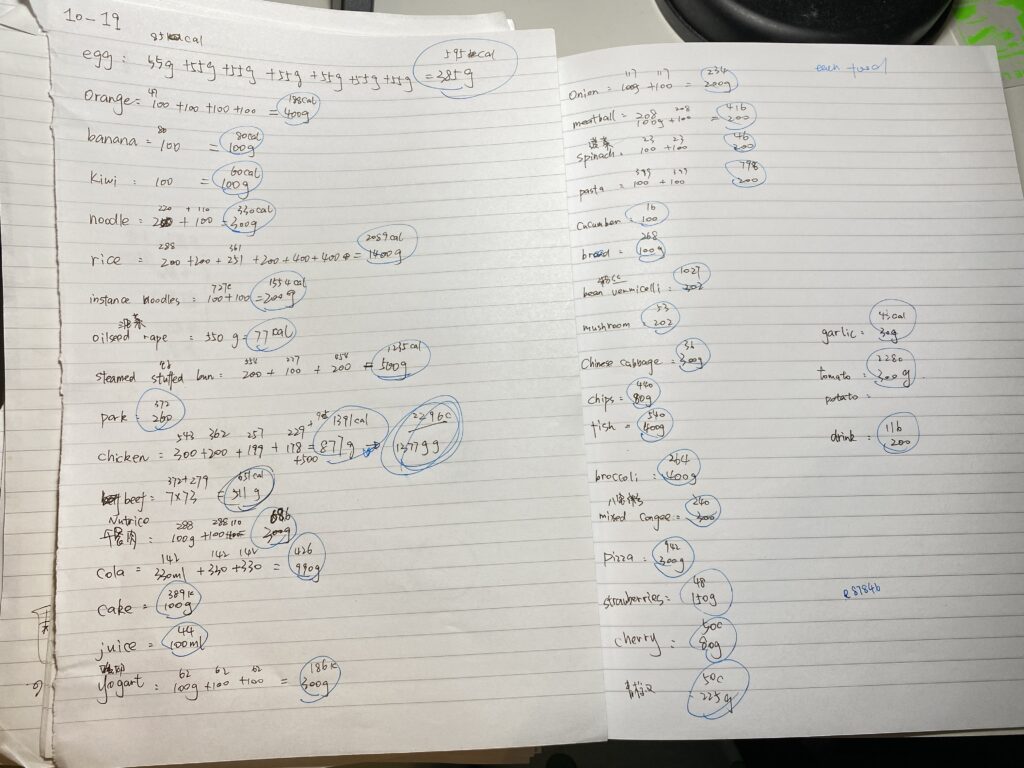
I counted the amount of nutrients in every food I eat
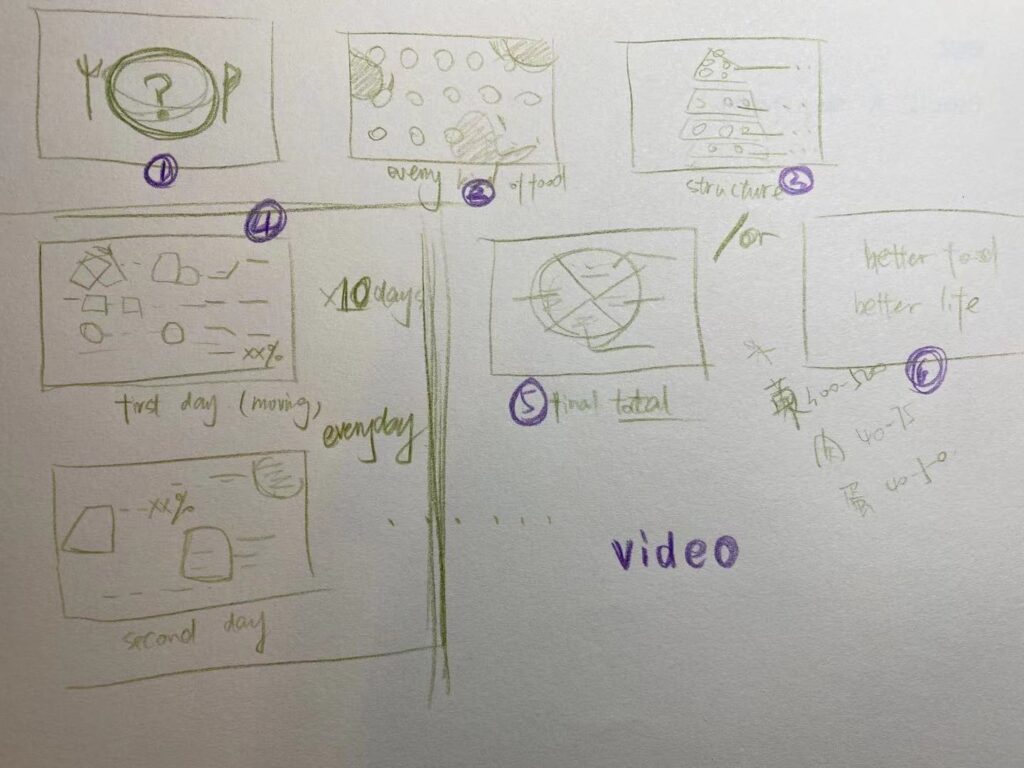
4. The sketch
Since there are two kinds of outcome to present data, I chose illustration and chart to present data at the beginning.
illustration
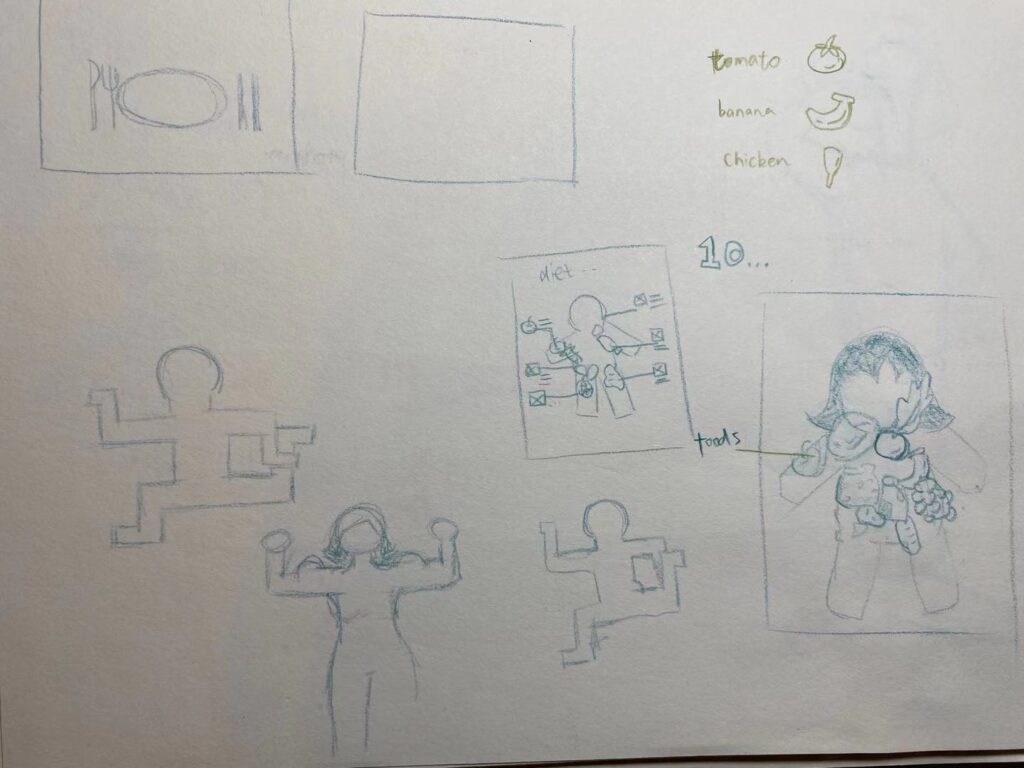
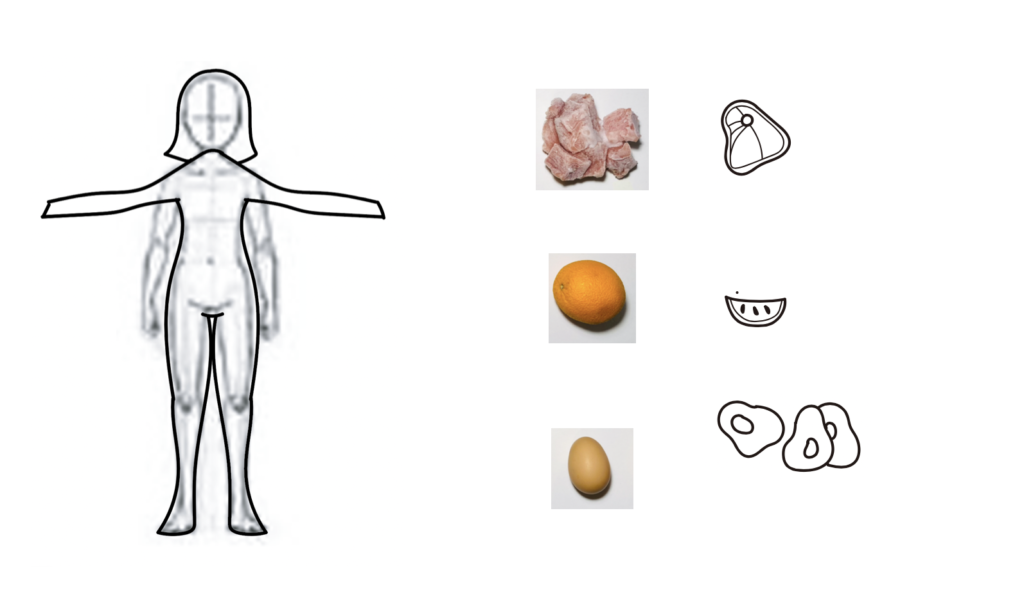
The food I have eaten this week is presented in the form of illustration. The main body is my silhouette, and the body part is composed of stacked food.
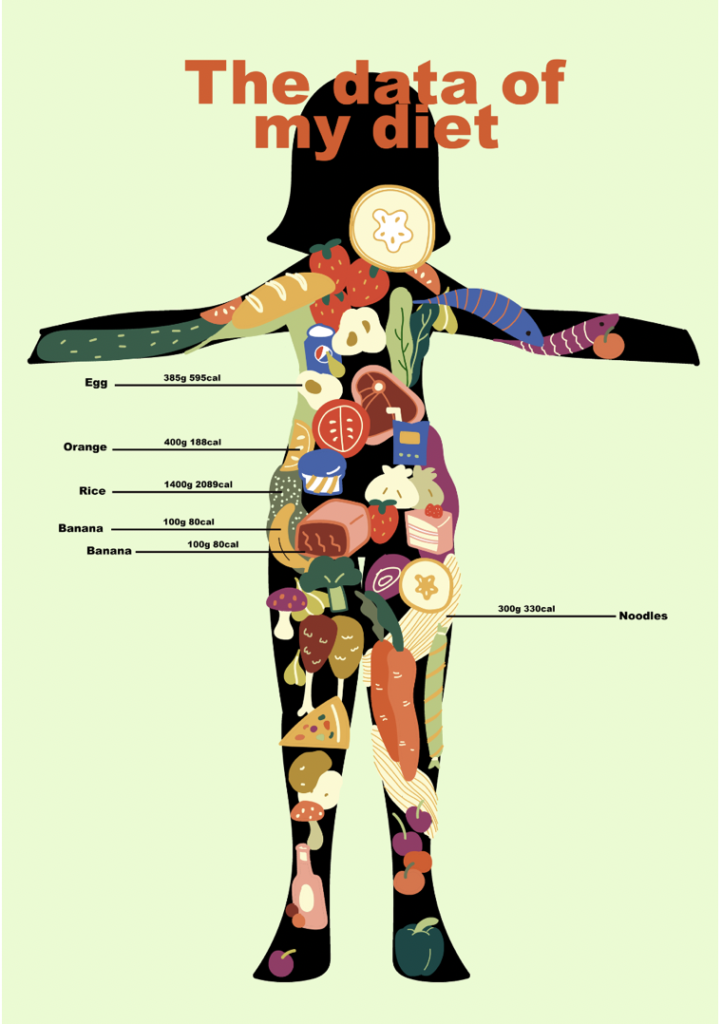
At this level, in the tutorial, the teacher thought there was nothing new in the outcome, so I changed another way
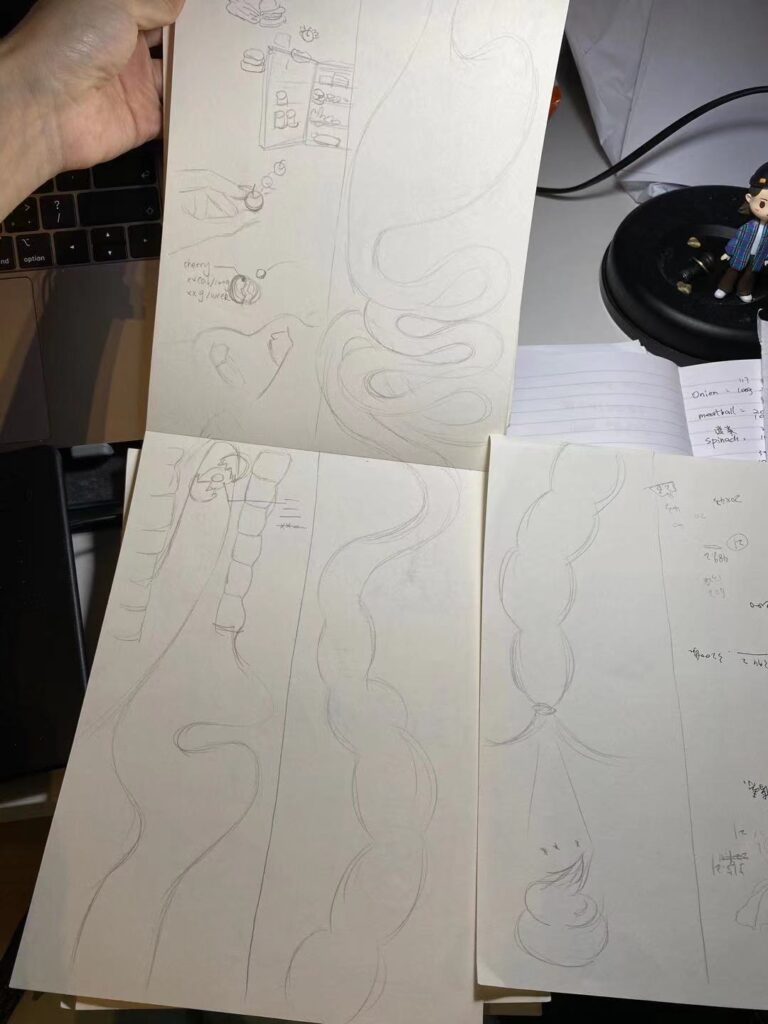
I took the form of a long illustration and resketched it.
The chart
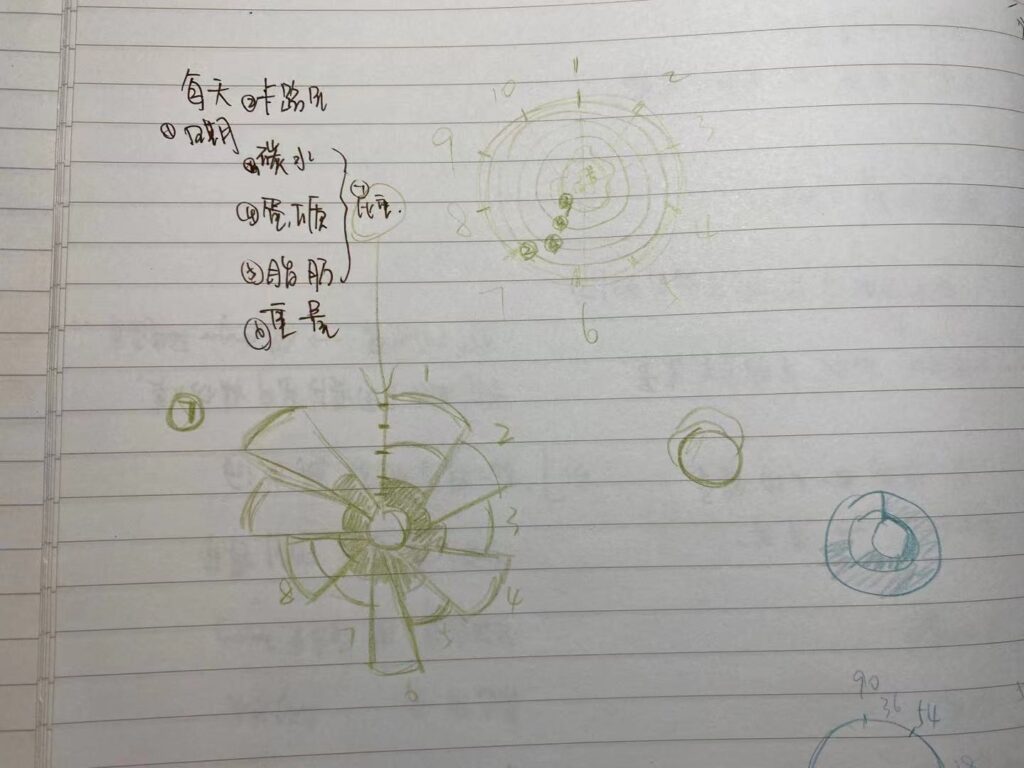
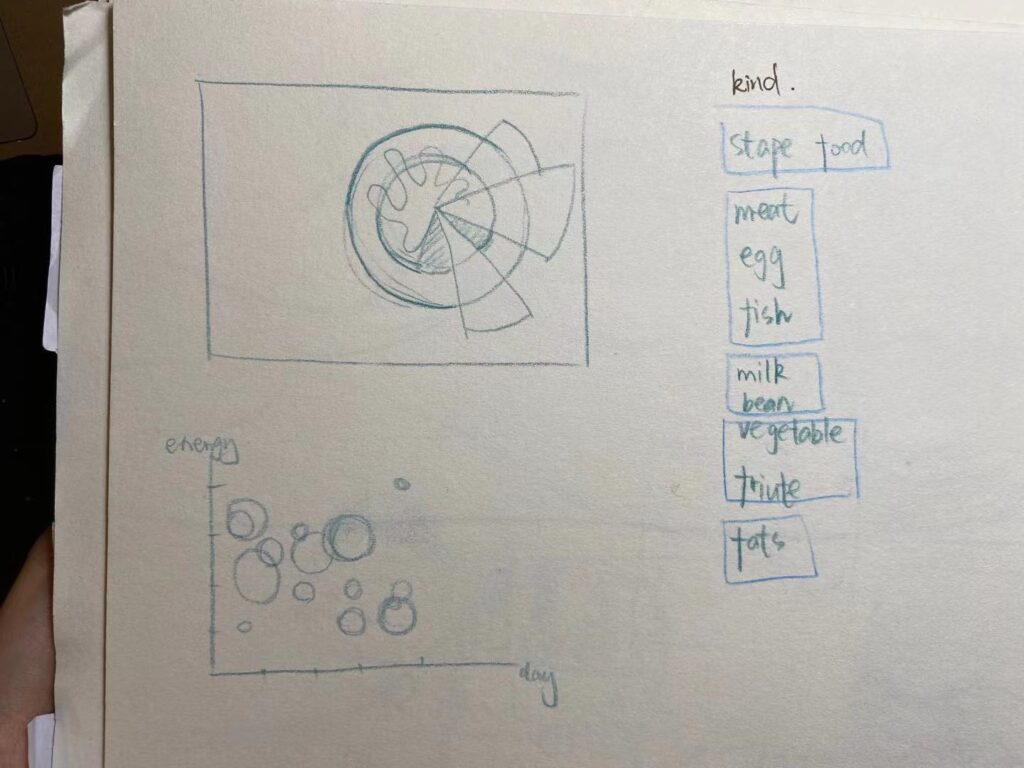
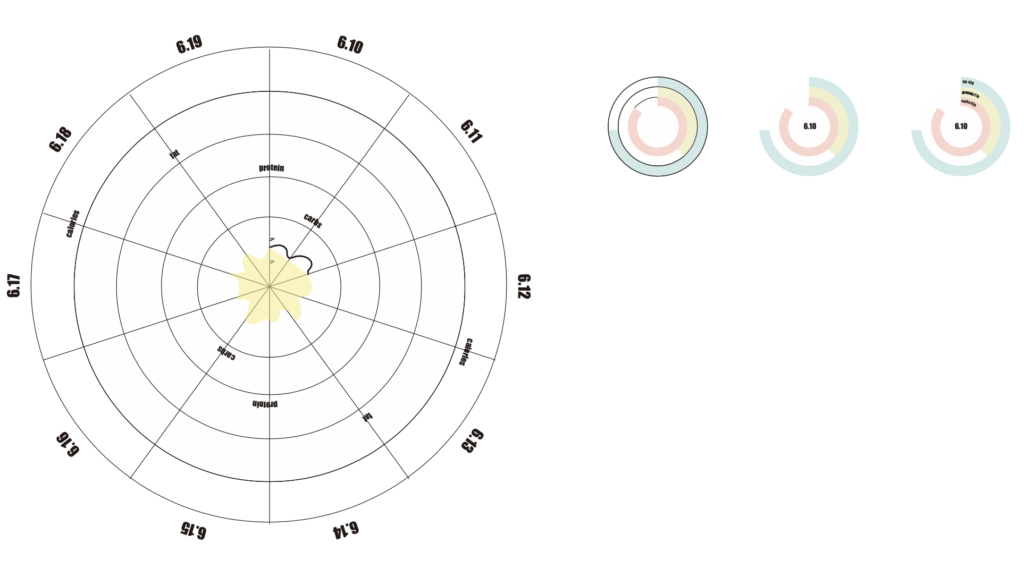
Jackie didn’t advise me to do this because the graphic presentation was too generic, so I dropped the idea and tried to show it in video instead.
video
5. Outcome
(1)illustration
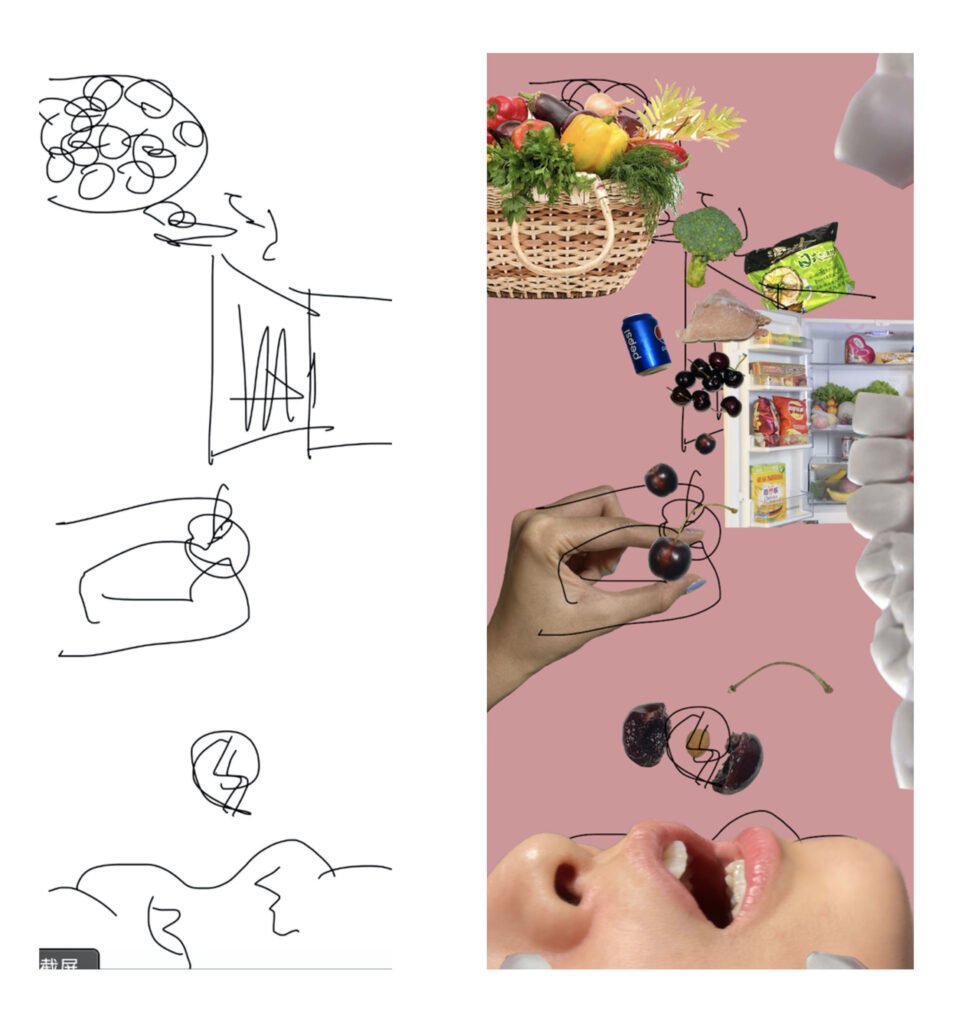
I depicted it sightseeing in my stomach from the perspective of a cherry pit that had been accidentally eaten. Along the way, it saw a lot of food and nutrient content, and I wanted to make boring data more interesting in this lively way.
(If the PDF version is not available, please check out the video I recorded)
(2)illustration
I took a lot of photos while recording the food, and I found the colors were very nice unexpectedly, so I tried to make them move and marked the nutrition amount of the food I ate every day.